Ease Monitor
1. 产品定位
Ease Monitor 有如下的产品定位:
关注于整体应用的SLA。 主要从为用户服务的 API 来监控整个系统。
关联指标聚合。 把有关联的系统及其指示聚合展示。主要是三层系统数据:基础层、平台中间件层和应用层。
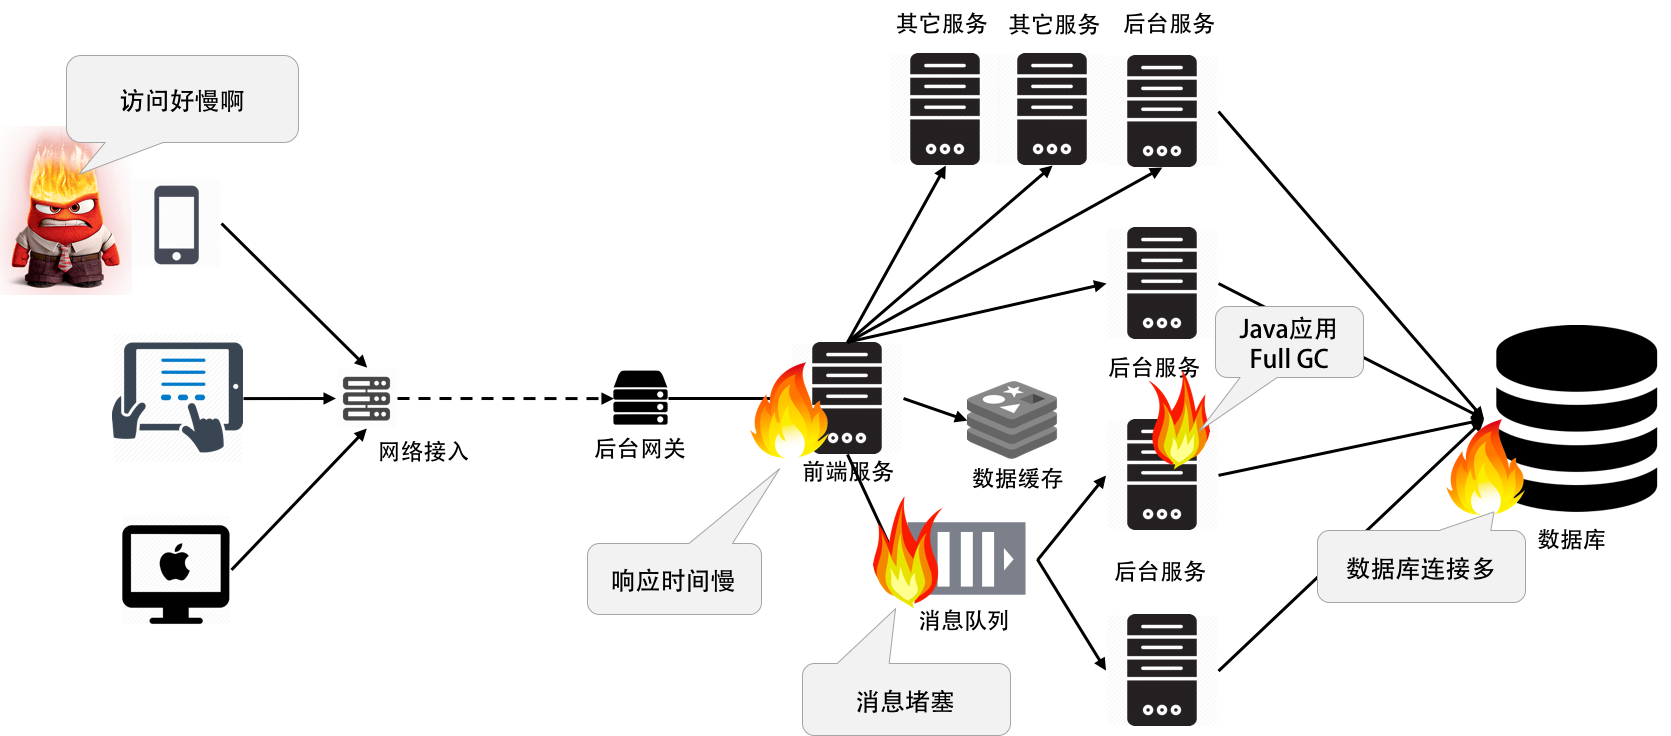
快速故障定位。 对于现有的系统来说,故障总是会发生的,而且还是会频繁发生。故障发生不可怕,可怕的是故障的恢复时间过长。所以,快速的定位故障就相当关键。
换句话说,Ease Monitor 主要是为以下两个场景所设计的:
“体检”
容量管理。 提供一个全局的系统运行时数据的展示,可以让工程师团队知道是否需要增加机器或是其它资源。
性能管理。可以通过查看大盘,找到系统瓶颈,并有针对性的优化系统和相应代码。
“急诊”
定位问题。可以快速的暴露并找到问题的发生点,帮助技术人员诊断问题。
性能分析。当出现不预期的流量提升,可以快速的找到系统的瓶颈,并可以帮助开发人员深入代码。
下图是一个很常见的情况:
2. 设计原则
Ease Monitor 其实是一种 APM - Application Performance Management,但是又不同于传统意议上的 APM 软件。
主要有下面两个方面影响了 Ease Monitor 的设计:
不同的工程视角。我们知道,在很多公司有不同的工程师角色,如:开发、应用运维、系统运维等等,他们会站在不同的地方来看一个系统,例如:
- 经理们主要关心的是整个系统的运行健康情况,不太关注细节。
- 软件开发工程师主要关注应用的运行状态。
- 运维人员主要关注底层和各种中间件的运行状态。
不重新发明轮子。重新开发一个监控就像是重新发明一个轮子,因为这个世界上已经有很多的监控系统了。所以,我们不想重新发明轮子。我们希望我们的
Ease Monitor是一个可以足够兼容现有的主流的监控软件,并且可以像乐高玩具一样,可以做到其中的组件随意替换随意剪裁的效果。
所以,Ease Monitor 有如下的设计原则:
使用主流的技术。 我们希望我们使用的技术是绝大多数的工程师团队熟悉并可以运维的。
组件都可以被替换和被裁剪。 因为不同的场景有不同的需求和业务形态,所以,设计必需做到有足够的灵活度可以容易地替换或裁剪相当的组件。
跟踪用户请求。 可以在一个分布式的系统,从端到端跟踪整个用户的调用。
引导工程能力。 好的一个监控至少可以让工程师做两件事:1)快速地定位故障,2)容易的做出工程上的决定。
驱动自动化。 一个好的监控系统可以和现有的集群控制系统关联起来,做自动化运维。如:自动化扩展,或是自动化的资源或流量调度。
全栈监控。我们必需对三层软件进行监控:
- 应用服务层。 在这一层上,主要是对应用服务的关键指针进行监控,如:
HTTP request,Status code,Throughput,Latency…等等。 - 平台中间件层。 在这一层上,主要是参考相关的中间件进行监控,如:
Nginx,Redis,Tomcat,Kafka,MySQL… 等等。 - 基础层。 在这一层上,主要是对相关主机的操作系统进行监控,如:
CPU,Memory,Disk,Network… 等等。
- 应用服务层。 在这一层上,主要是对应用服务的关键指针进行监控,如:
自定义的仪表盘。 不同的用户有不同的视角,所以,用户可以定义自己感兴趣的仪表盘。
3. 系统架构设计
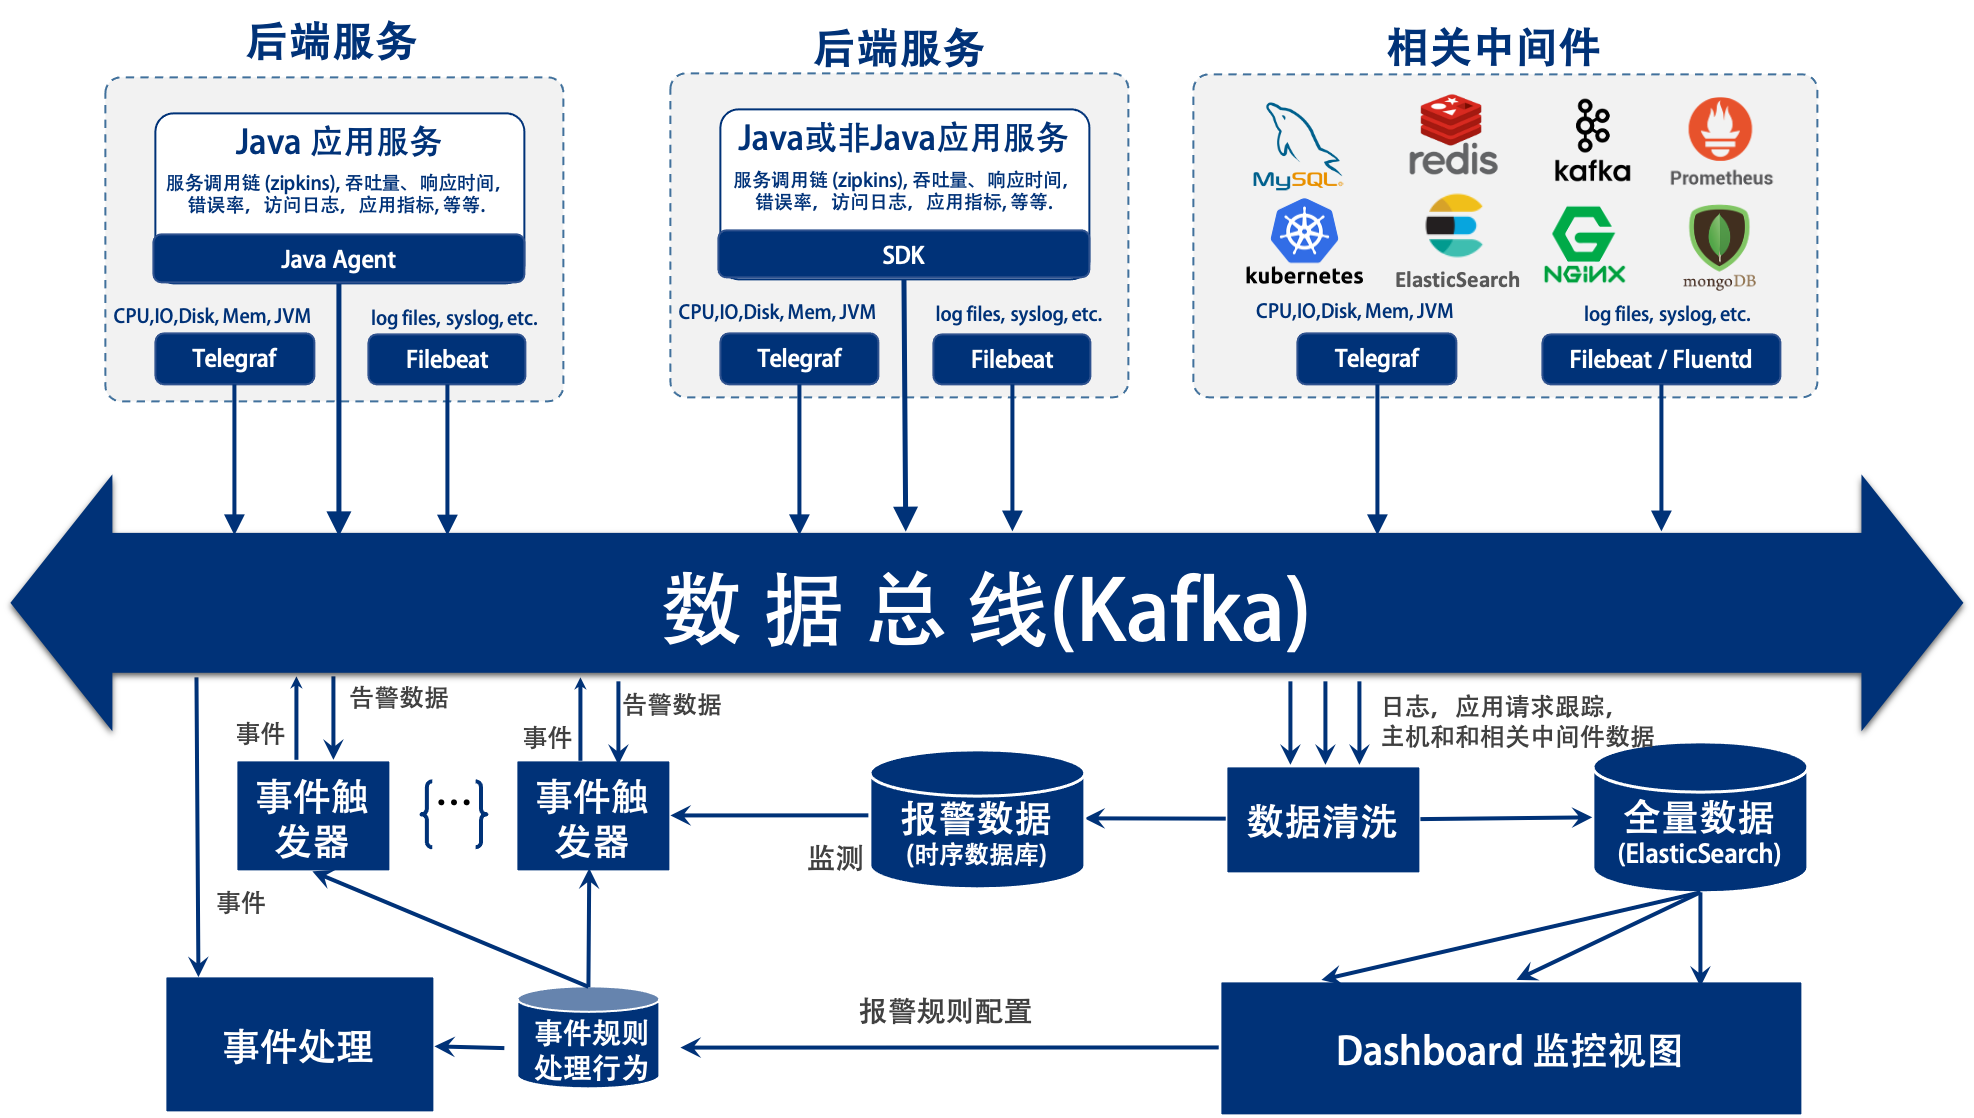
上图是整个 Ease Monitor 的架构图所用到的技术。
- 数据采集端
- 数据处理管线
- 数据总线 - Apache Kafka
- 数据 ETL - Logstash
- 数据存储 - ElasticSearch
- 报警数据 - InfluxDB
- 报警触发和报警处理 - 我们自研了这个组件。详见 “技术细节” 一节
- Web前端控制台 - 我们自研了这个组件。详见 “技术细节” 一节
对于这个技术架构,其中的技术都是主流的成熟的,其被设计于可以监控一个规模很大的集群,而且其中的组件是可以被灵活的裁剪和取代。
4. 系统要求和限制
目前,Ease Monitor 只支持如下的系统环境。
- Java 语言系的应用。Java的版本得 >= 1.6
- Linux 操作系统。
5. 功能展示
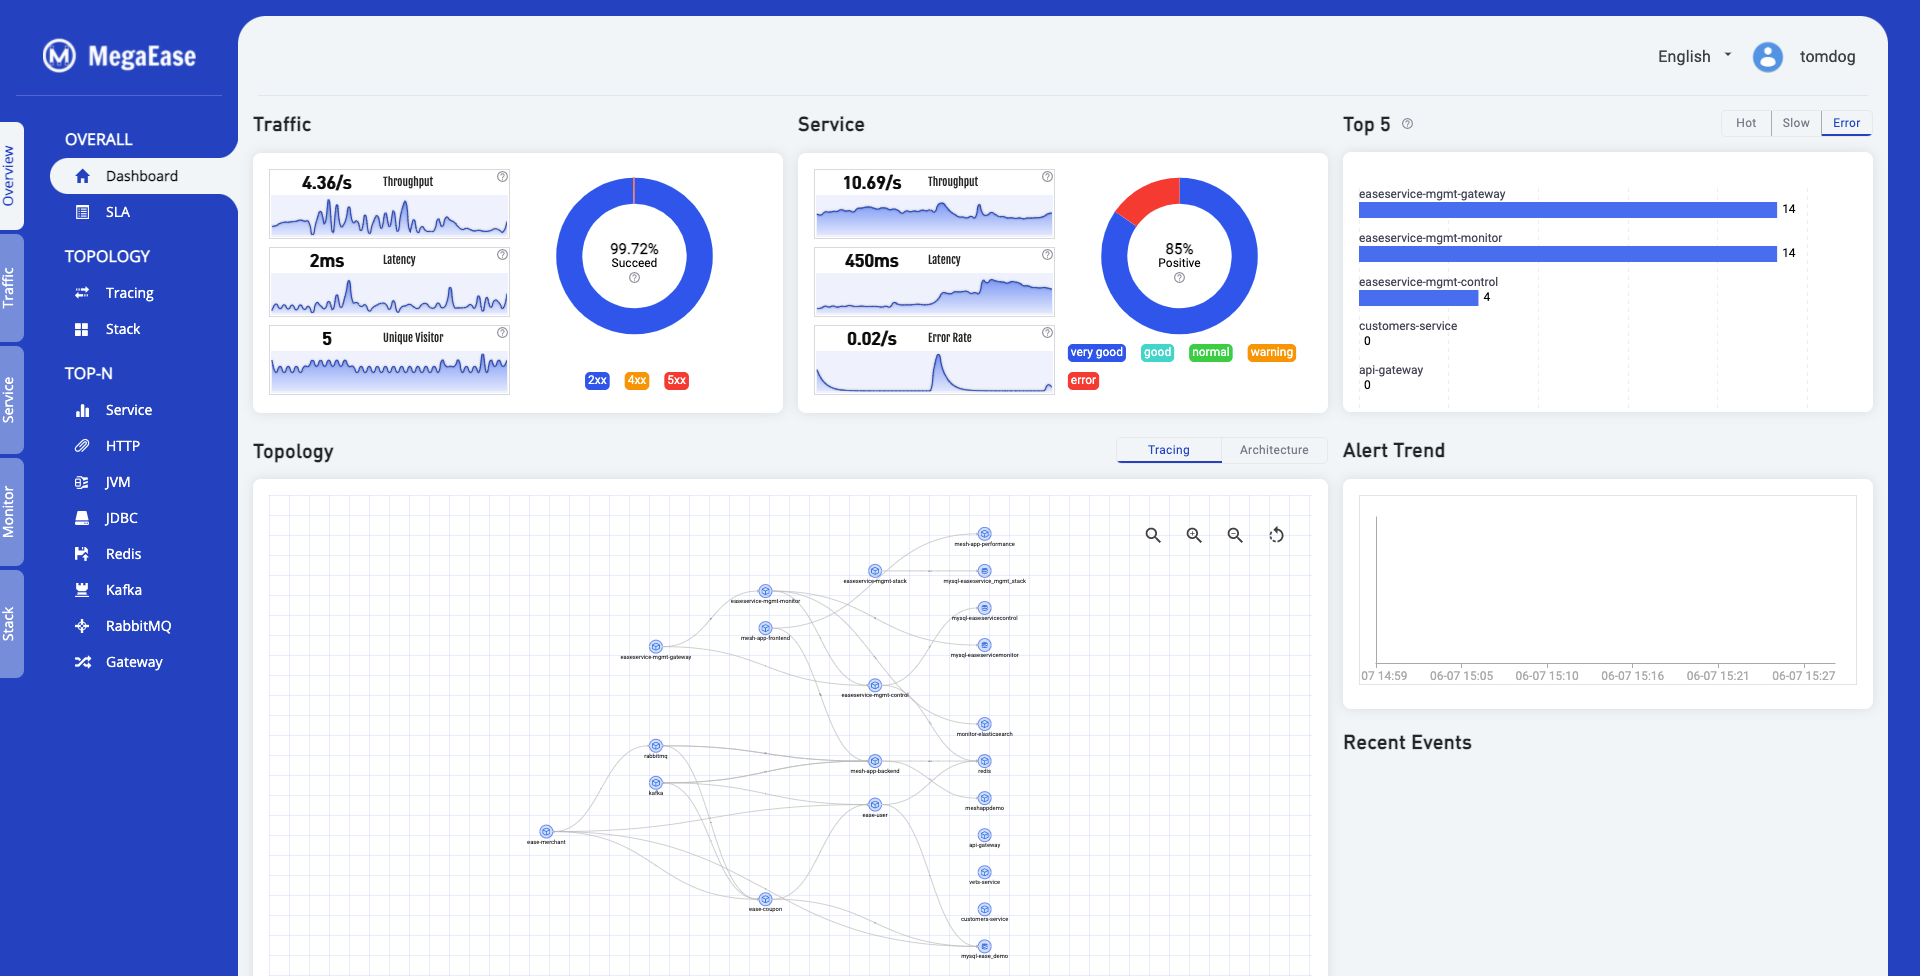
5.1 总体仪表板
总体仪表板主要展示了系统整体的健康和容量情况。
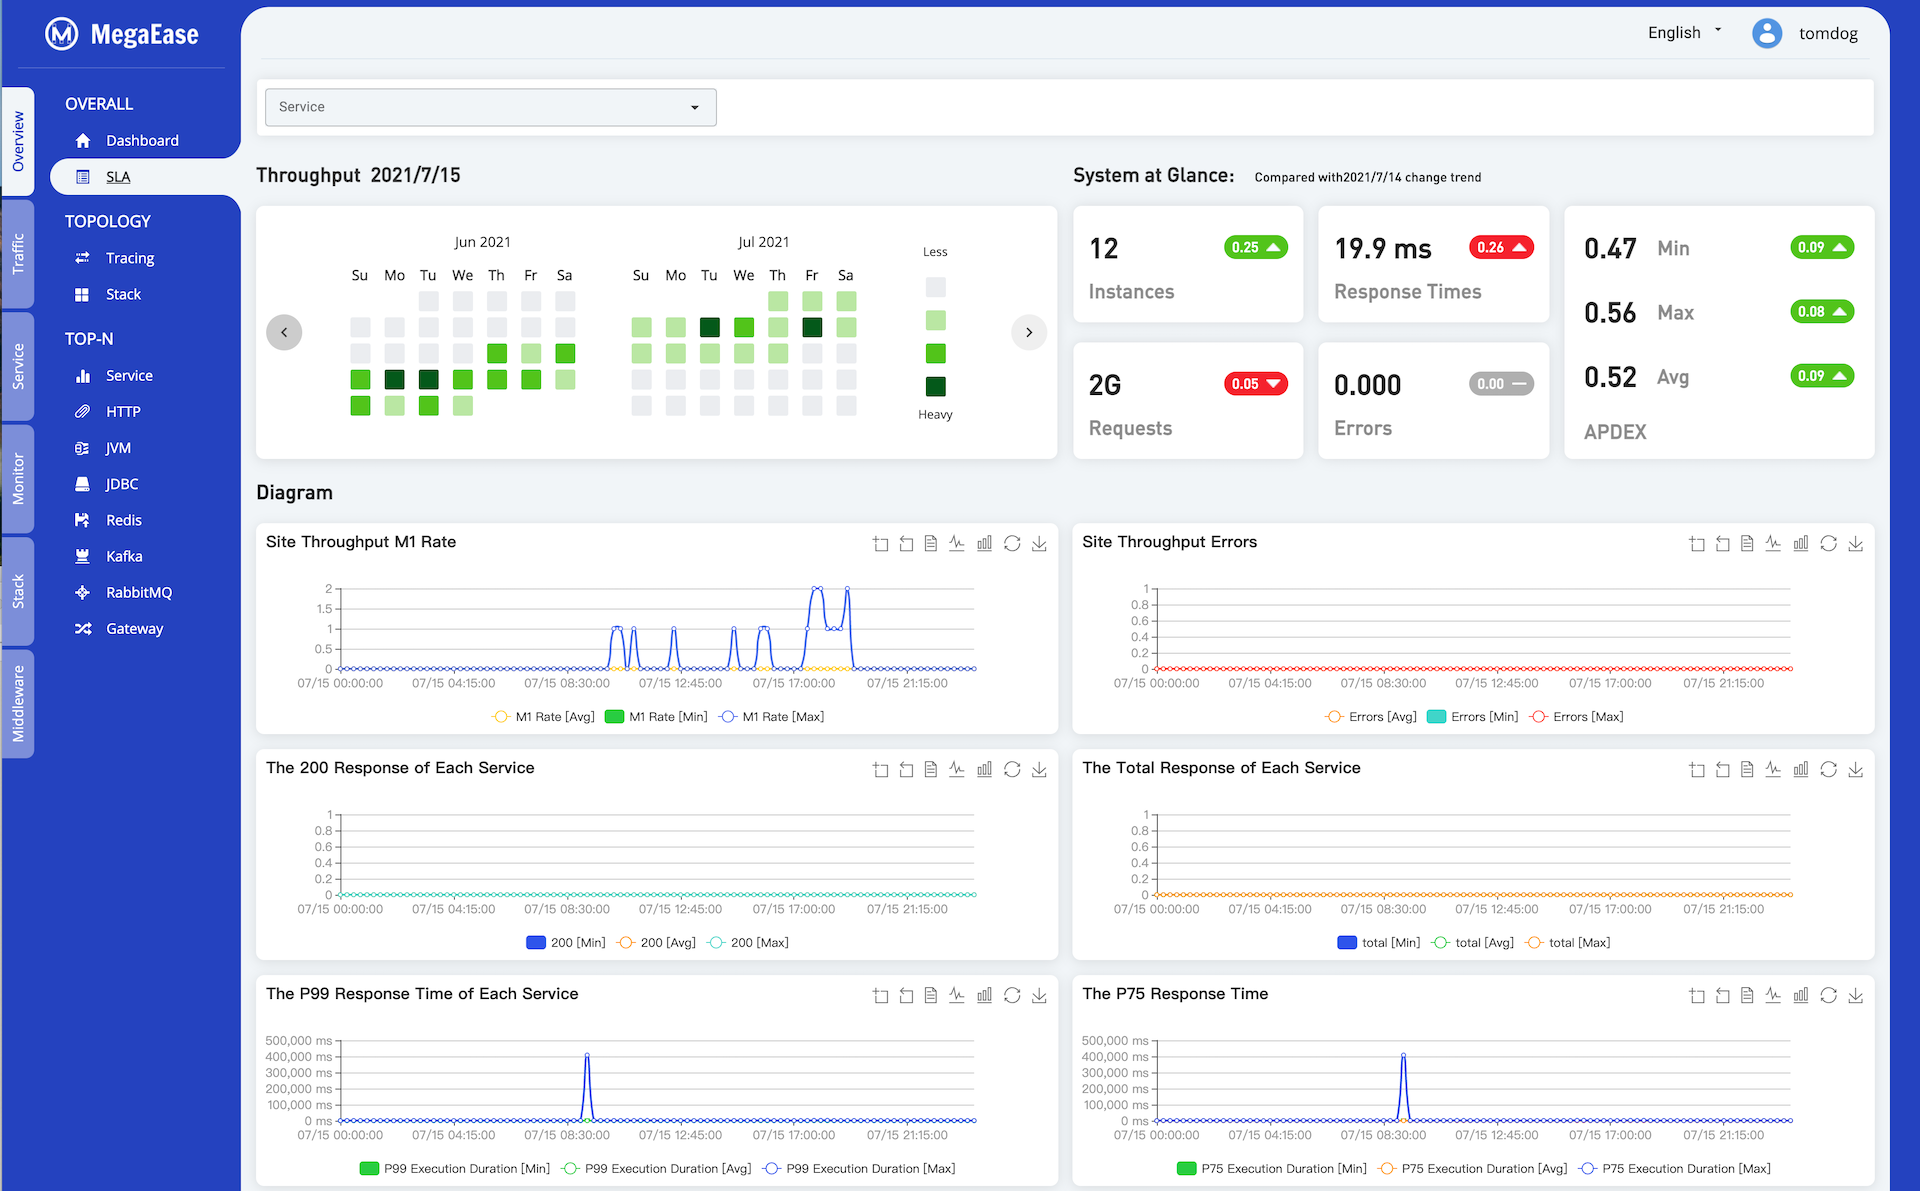
5.2 服务 SLA 日报
下图展示了服务的SLA报告,可以是全站的,也可以是单个服务的
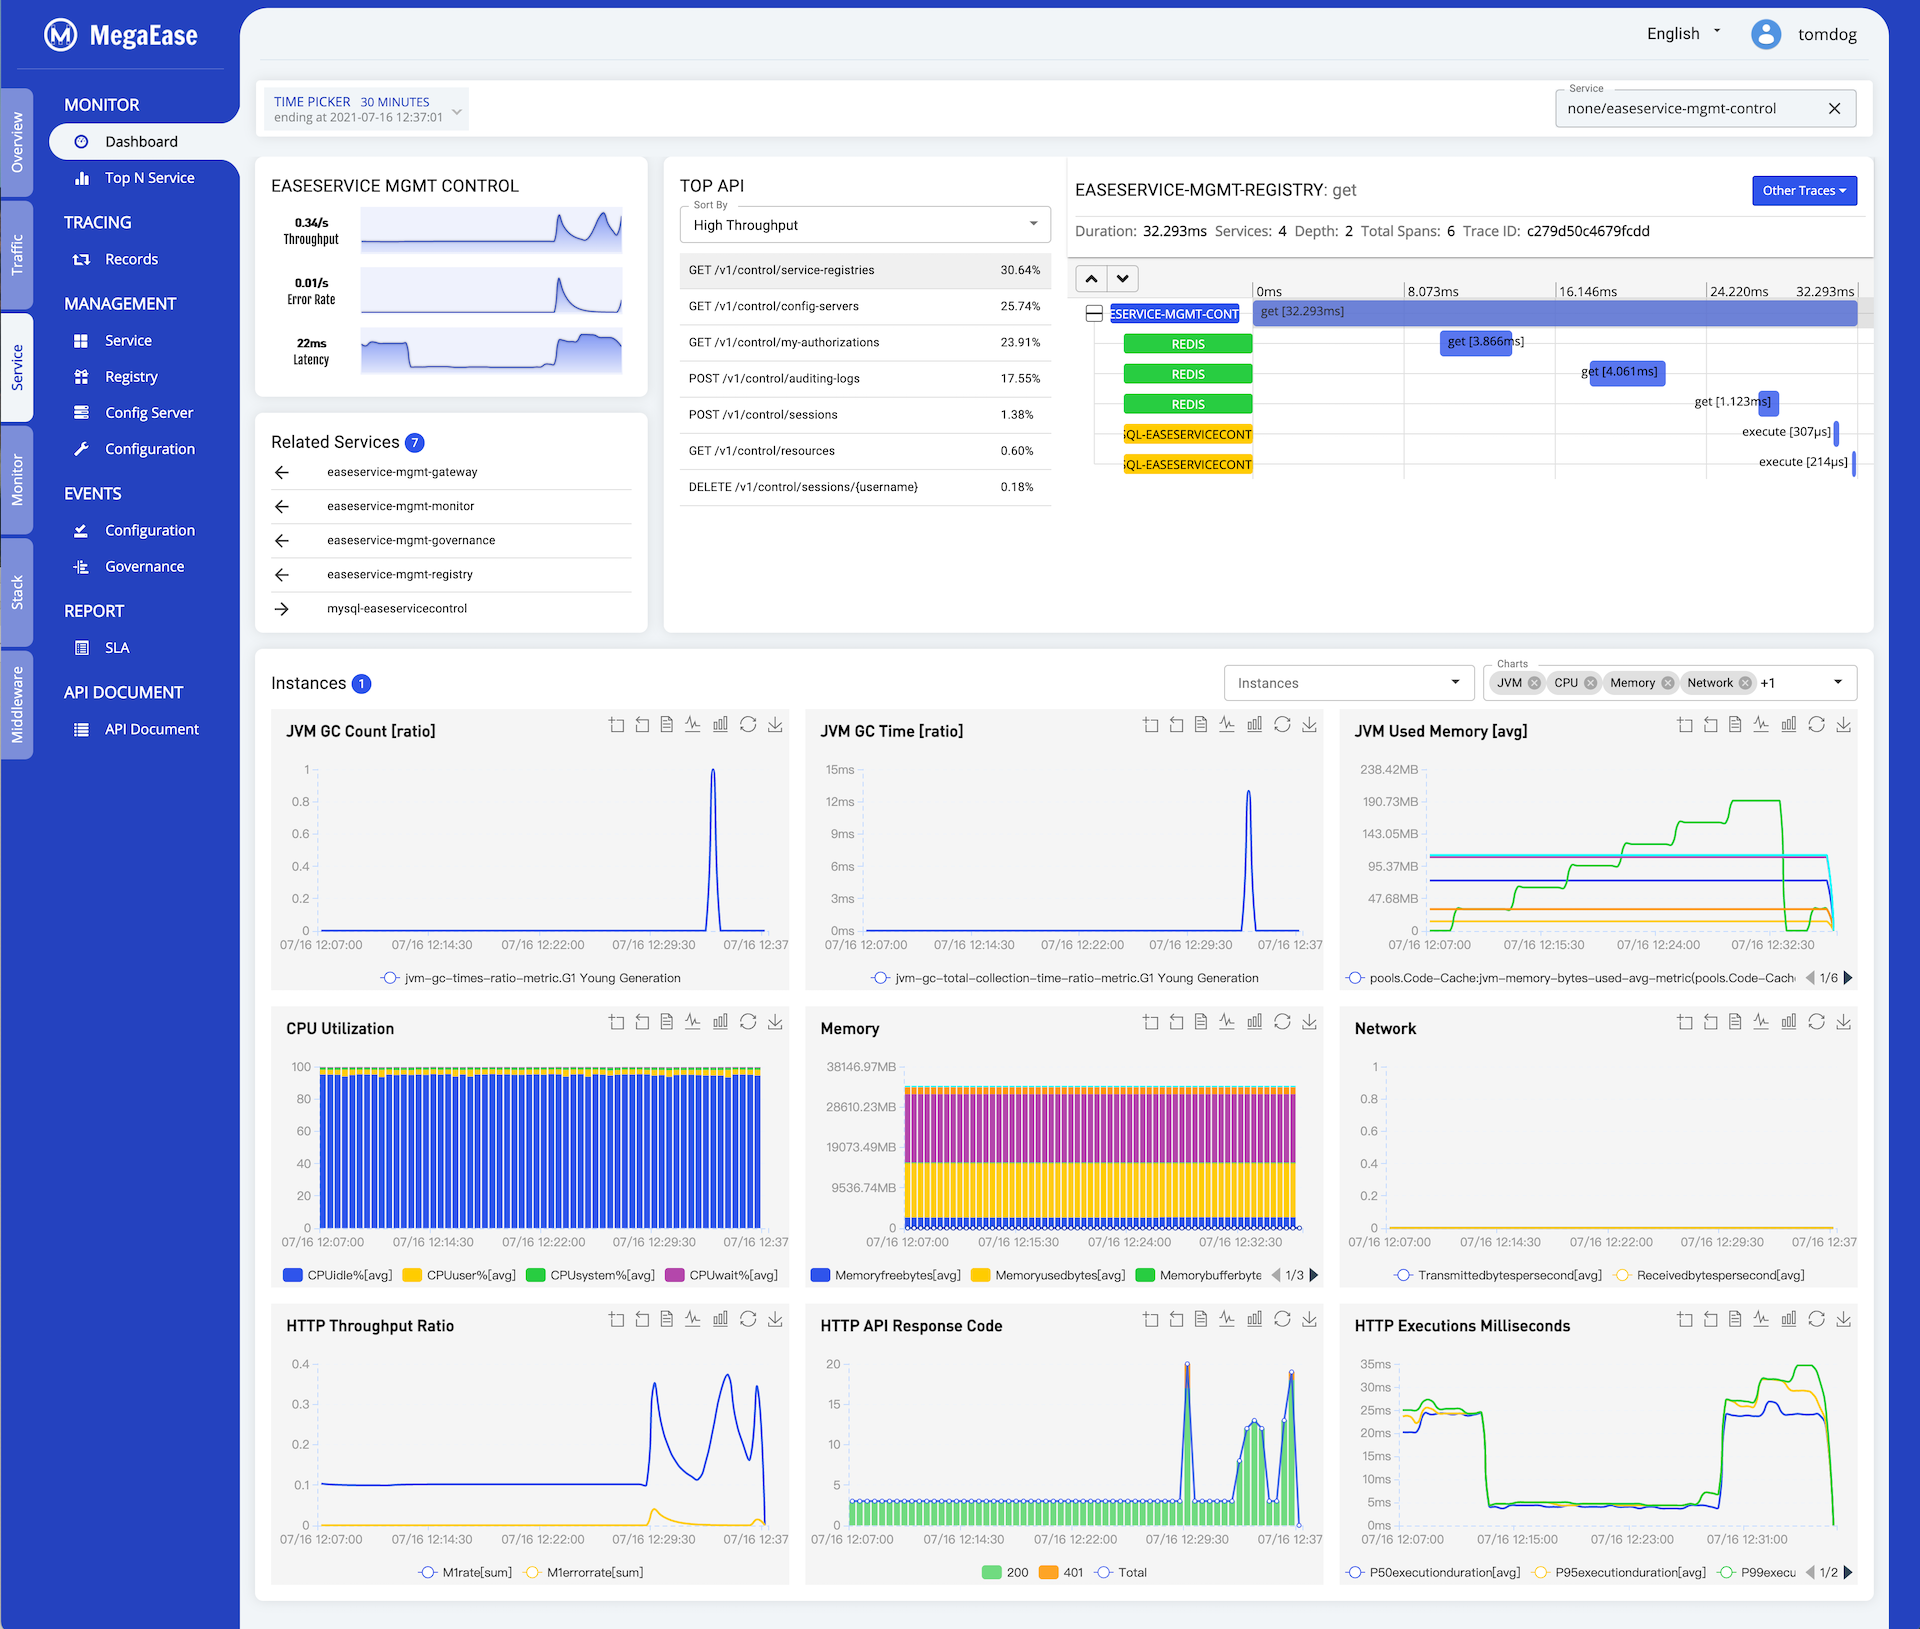
5.3 面向服务的大盘
下图整合了服务的流量,服务的上下游,服务的TOP API,最慢的Tracing,相关资源使用指示的整体大盘
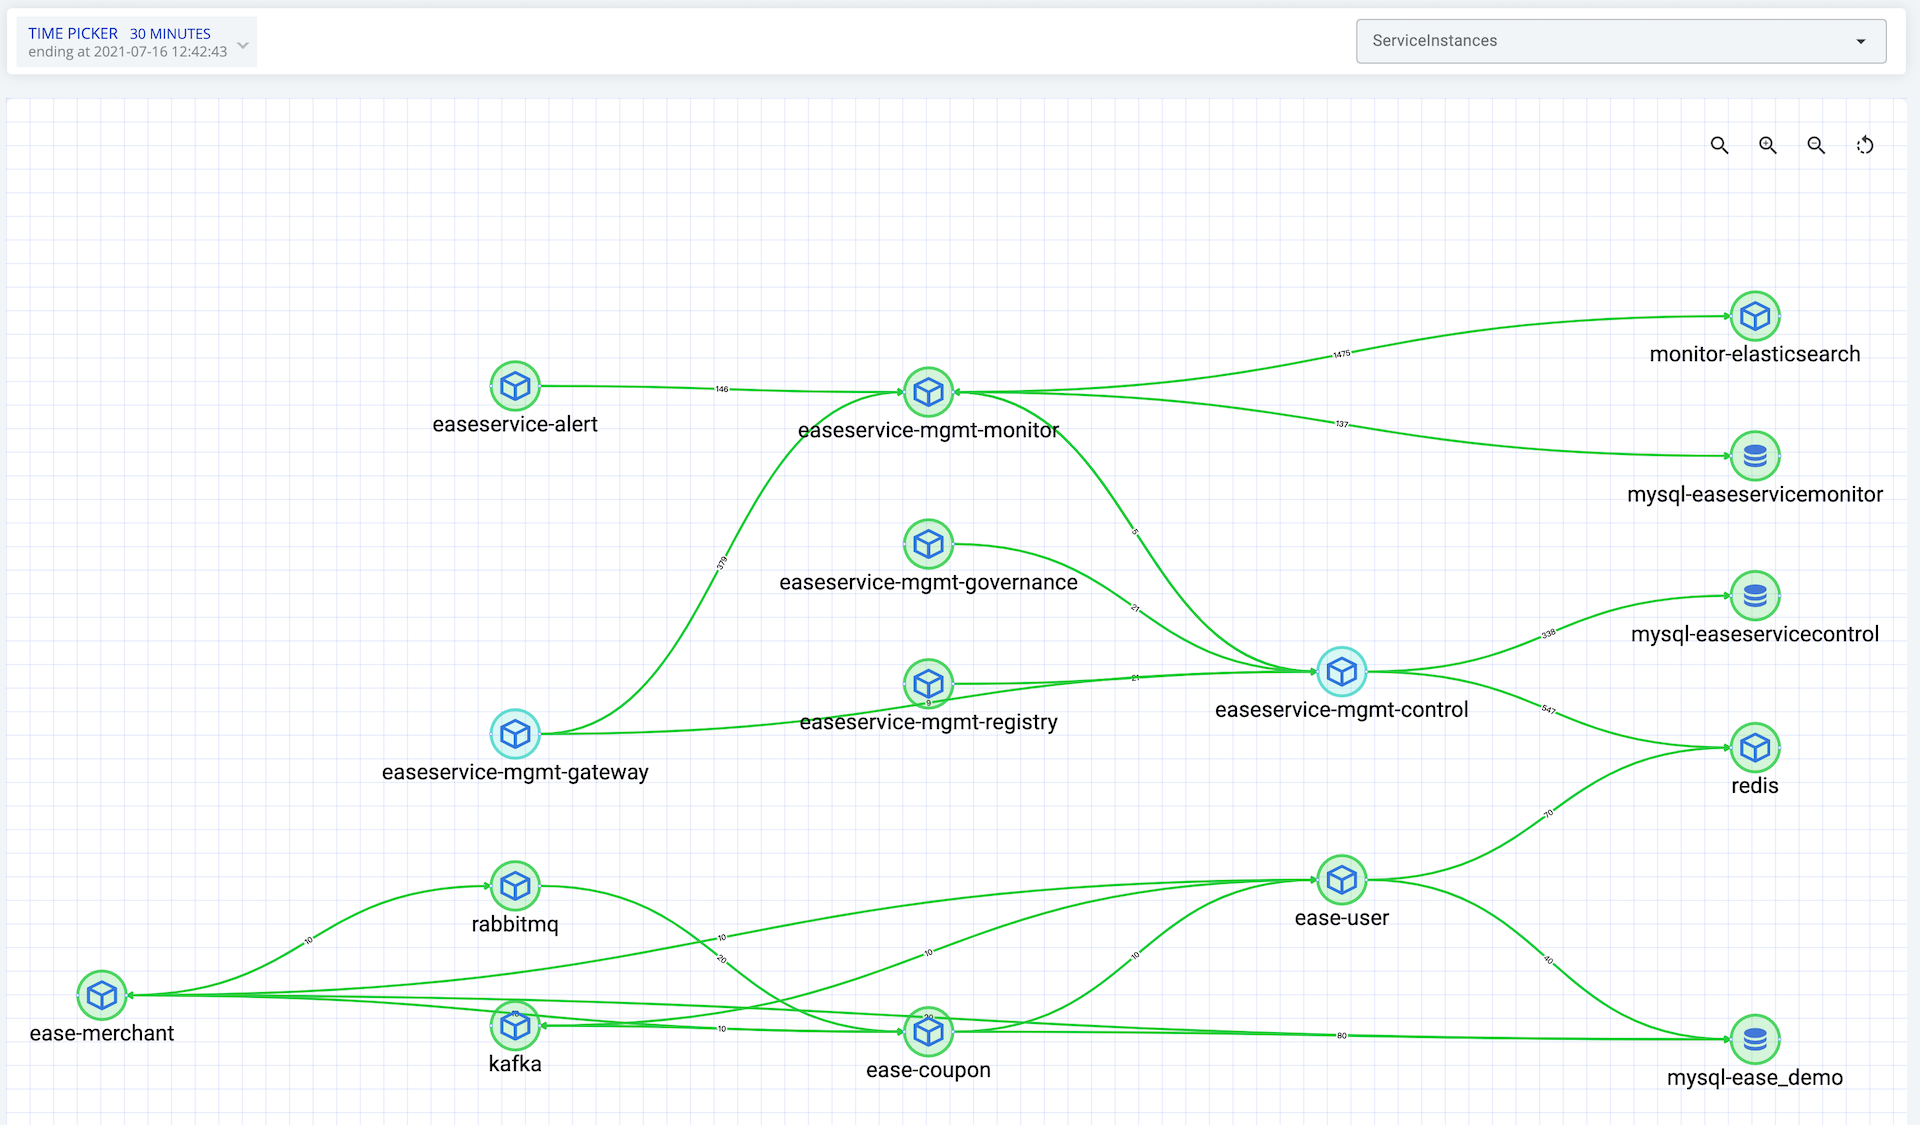
5.4 调用链跟踪
下图展示了一个整体调用拓扑图。
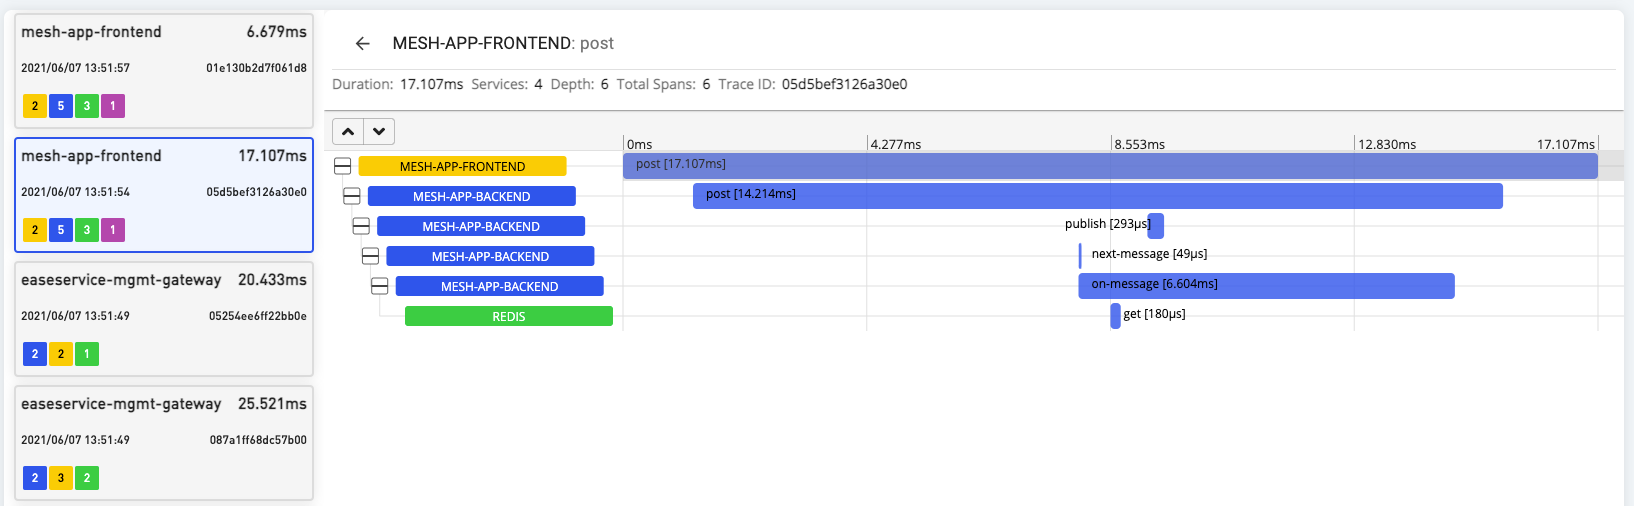
下图展示了一个请求在整个系统中的服务调用链以及相应的时间分布。
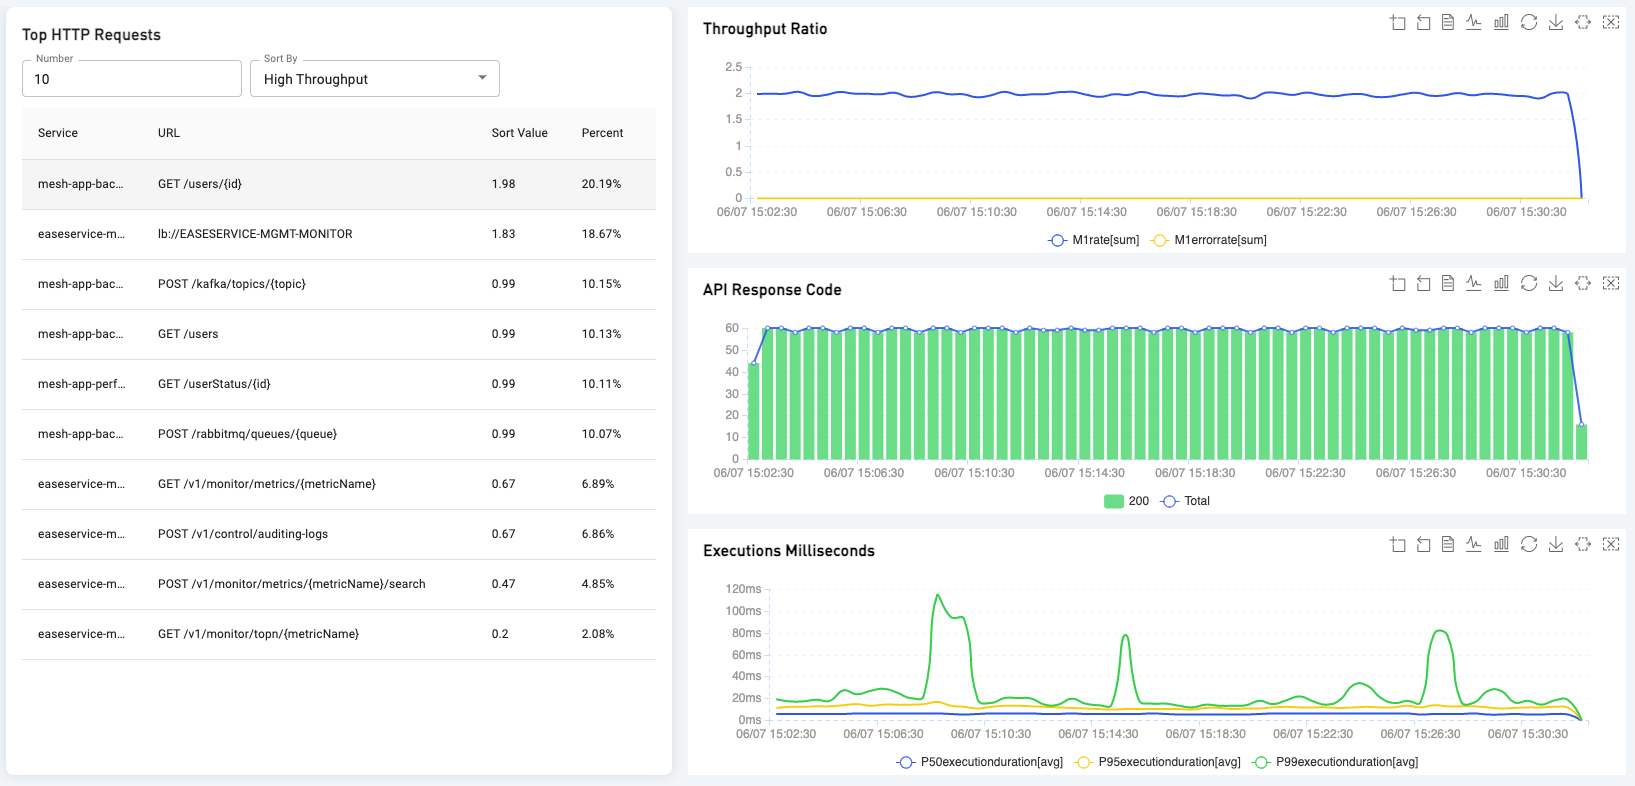
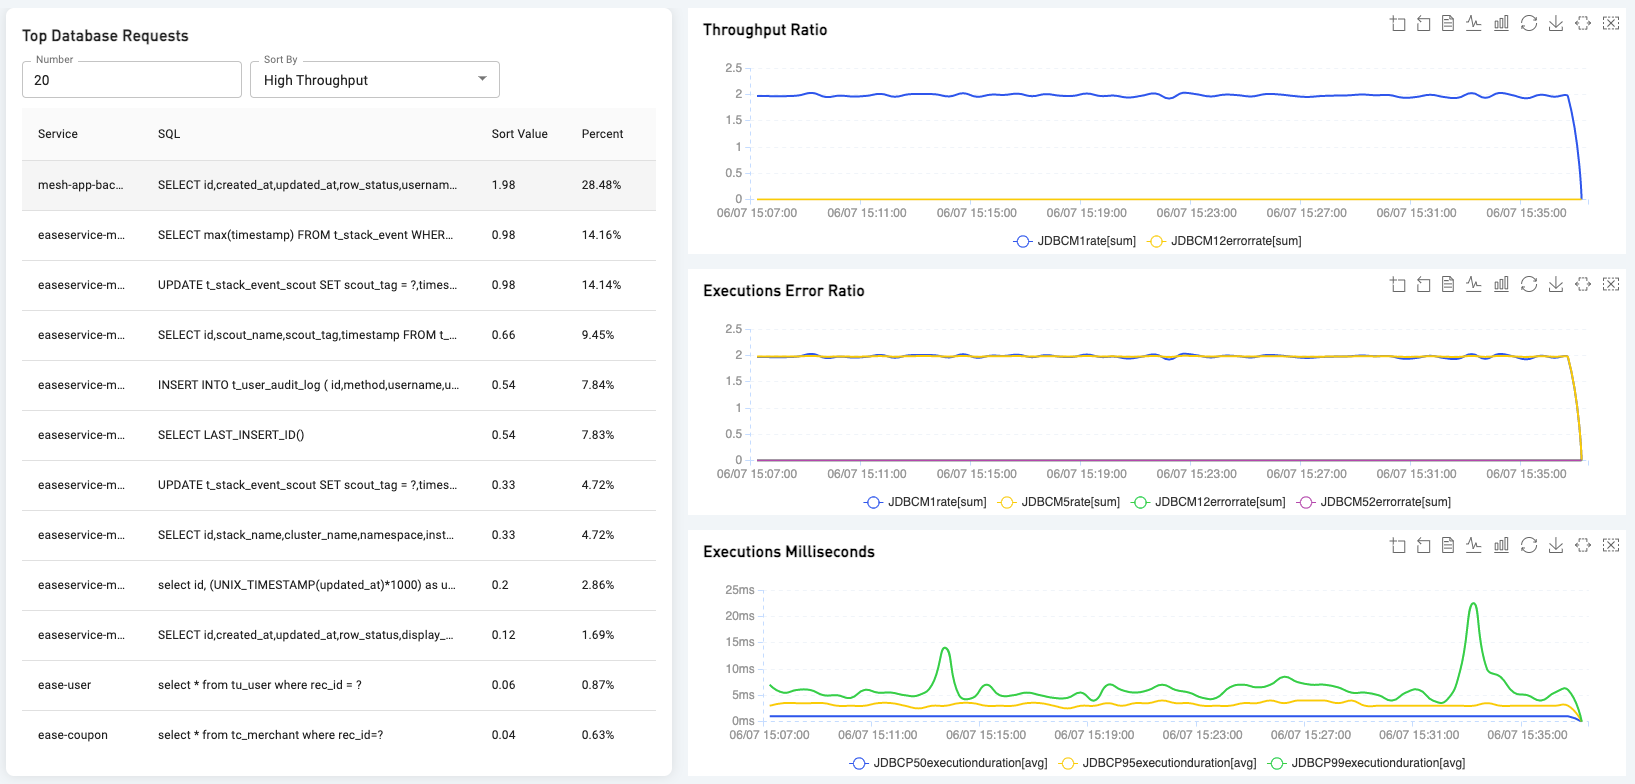
5.5 系统请求排名列表
系统请求排名列表列出了系统比较耗时的请求以及相关的请求热点。
Nginx 请求排名列表
JDBC 数据库操作排名列表
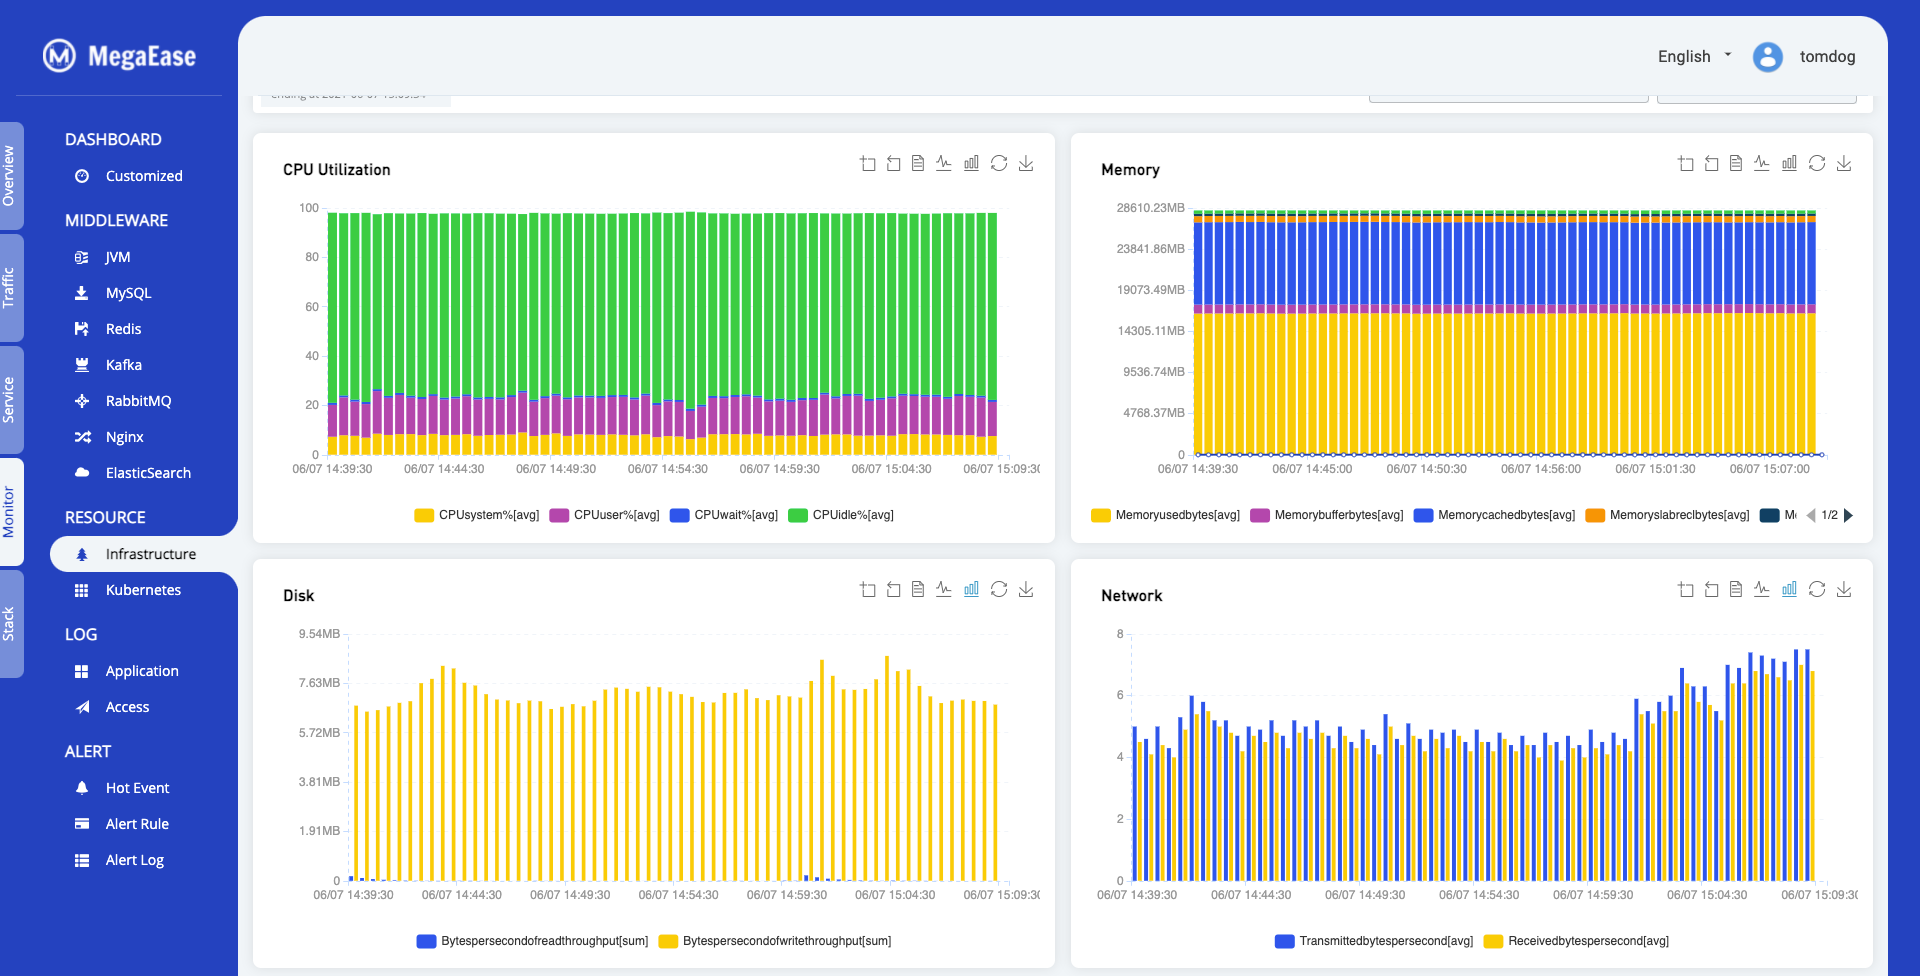
5.6 可自由定制的仪表盘
基础操作系统的仪表盘
6. 技术细节
6.1 EaseAgent
EaseAgent是一个使用Instrument API开发的 Java Agent,使用字节码增强的方式对应用的性能和调用链数据进行收集。- 它针对使用Spring Boot的代码做了大量的增强。
- 兼容主流监控生态系统,如Kafka、ElasticSearch、Prometheus、Zipkin等。
- EaseAgent 收集基本指标和服务跟踪日志,对性能分析和故障排除很有帮助。
6.1.1 设计原则
- 它遵从微服务架构设计,从服务的角度收集数据。
- 以无侵入的方式对应用程序字节码进行增强。
- 轻量级并且对CPU、内存和 I/O 资源使用率非常低。
- 对Java应用程序是安全可靠的。
6.1.2 兼容性与要求
- 记录性能数据和调用链日志
JDBC 4.0HTTP Servlet、HTTP FilterSpring Boot 2.2.x:WebClient、RestTemplate、FeignClientRabbitMQ Client 5.x、Kafka Client 2.4.xJedis 3.5.x、Lettuce 5.3.x
- 记录访问日志
HTTP Servlet、HTTP FilterSpring Cloud Gateway
- 支持在应用的日志中增加
traceIdandspanId。 - 提供健康检查的API。
- 提供应用就绪检查的API。
6.1.3 采集数据种类
- 服务器收到 HTTP 请求的 Metric。
- JDBC
Connection获取和Statement执行的 Metric, 以及调用关联信息(如 URL,SQL等) - 兼容 Zipkin 协议的分布式调用链数据,包括:
- HTTP 接收 与 发送
- SQL 执行
- Redis 访问
6.1.4 安装与使用
从 release 下载 easeagent.jar 后, 添加如下 Java 运行时参数:
-javaagent=easeagent.jar
6.2 事件报警
当前,Ease Monitor 的事件报警支持如下的用户案例。
指标 - 持续时间 - 阈值。 当一个指标在一个时间段内持续超过所配置的阈值,引发报警。如:在两分钟内 cpu 利用率持续超过 80% 。
指标 - 持续时间 - 百分比分布 - 阈值。 当一个指标在一个时间段间的某个百分比分布超过所配置的阈值,引发报警。如:99%的请求响应时间在两分钟内超过 300ms (即:P99)
指标 - 持续时间 - 函数 - 阈值。 支持一些简单的函数计算 Sum/Average/Min/Max/Count。如:在两分钟内 JVM 的 GC 次数超过所配置的阈值(使用Sum函数)。
日志 - 持续时间 - 关键词 - 匹配次数。监控日志中某个关键词在一个时间段内出现的次数超过某个数量,引发报警。关键词支持正规表达式匹配。
6.3 数据存储格式
下面是 Ease Monitor 在 ElasticSearch 中的数据存储格式。
6.3.1 索引格式
| Index mapping template | Index pattern | Description |
|---|---|---|
| ease-monitor-metrics-* | ease-monitor-metrics-YYYY.MM.DD | Saves time series based metrics of monitored object from different categories. The metrics from different monitored object will be saved into a dedicated document type. |
| ease-monitor-aggregate-metrics-* | ease-monitor-aggregate-metrics-YYYY.MM.DD | Saves calculated performance statistics from different dimensions monitoring requirement needed. The statistics from different dimensions will be saved into a dedicated document type. Due to the statistic calculation are executed on these input metrics directly as streaming and the results will be saved into this index in advance, so the statistics can be loaded and used without any further aggregation(e.g. grouping and computing). This will definitely help the performance of ad-hoc query on the fine-grained metrics ES stored, especially on a large metrics data volume. This index was designed only to save these statistics ones can be calculated by a simple (fast) and fixed (can be implemented on product design stage instead of runtime stage) functions. |
| ease-monitor-logs-* | ease-monitor-logs-YYYY.MM.DD | Saves the logs outputted from OS, middleware and application. The different logs will be saved into a dedicated document type. |
6.3.2 文档类型格式
我们有如下的文档类型的存储格式:
Index mapping template
ease-monitor-metrics-*- 用于存储时序类型的指标数据。ease-monitor-aggregate-metrics-*- 用于存储 Java Agent 所采集的数据。ease-monitor-logs-*- 用于存储日志数据。
Category
application- 表明是应用层的数据种类。platform- 表明是平台层中间件的数据种类。如:nginx,redis,tomcat,mysql,kafka… 等等。infrastructure- 表明是基础层的数据种类。如:CPU,MEM,DISK,NET指标。
Document Type
- 组件名称
- 组件的指标和统计名。
相关示例:
| Index mapping template | Category | Document type | Description |
|---|---|---|---|
| ease-monitor-metrics-* | application | http_request | Saves application HTTP request records, which contains URL address and parameters, execution duration, response code and other useful fields. |
| platform | jvm_memory | Saves JVM performance counters and statistics for heap, non-heap and each spaces. | |
| jvm_gc | Saves JVM performance counters and statistics for garbage collector. | ||
| tomcat_global | Saves the performance counters and statistics of global request processor and thread pool. | ||
| tomcat_cache | Saves the performance counters and statistics of each context cache. | ||
| tomcat_servlet | Saves the performance counters and statistics of each servlet. | ||
| nginx | Saves nginx performance counters and statistics. | ||
| mysql | Saves mysql performance counters and statistics. | ||
| redis_server | Saves redis server performance counters and statistics. | ||
| redis_keyspace | Saves redis key space performance counters and statistics. | ||
| infrastructure | cpu | Saves the percentage utilization of special logic core. | |
| memory | Saves the percentage utilization and capacity in bytes. | ||
| interface | Saves the performance counters and statistics for each interface separately (without ’lo’ loop device), e.g. tx and rx bytes. | ||
| disk | Saves the performance counters and statistics for each block device separately, e.g. iops, mbps. (busy percentage indicator will be added in future). | ||
| df | Saves the utilization counters for each block device | ||
| ease-monitor-aggregate-metrics-* | application | http_request | Saves the calculated values of separated and total executions per second in every 1, 5, 15 minutes. The request count will be saved as well. |
| jdbc_statement | Saves the calculated values of separated and total executions per second in every 1, 5, 15 minutes. And also saves minimal, mean, maximal and 25%, 50%, 75%, 95%, 98%, 99%, 99.9% user’s execution duration. The execution count will be saved as well. | ||
| jdbc_connection | Saves the calculated values of database connection establishment per second in every 1, 5, 15 minutes range. And also saves minimal, mean , maximal and 25%, 50%, 75%, 95%, 98%, 99%, 99.9% user’s connection establishment duration. The establishment count will be saved as well. | ||
| ease-monitor-logs-* | application | <component-name> | Saves log records collected from application’s component. |
| platform | tomcat_exception | Saves the exception messages of the stack. | |
| nginx_access | Saves HTTP access records from nginx access log. | ||
| nginx_error | Saves error records from nginx error log. | ||
| mysql_slow_sql | Saves slow SQL records from MySQL log. | ||
| infrastructure | os_syslog | Saves log records from OS ‘syslog’ file. | |
| os_dmesg | Saves log records from OS ‘dmesg’ file. |