EaseAgent - Observability, non-intrusive observation system
Background
With the popularity of microservice architectures, troubleshooting and locating problems has become very difficult and observability has become a fundamental requirement for distributed systems. A distributed tracing system for locating problems is one of the most important aspects of observability. With the increasing demand, many APM (Application Performance Management) products have emerged in the market.
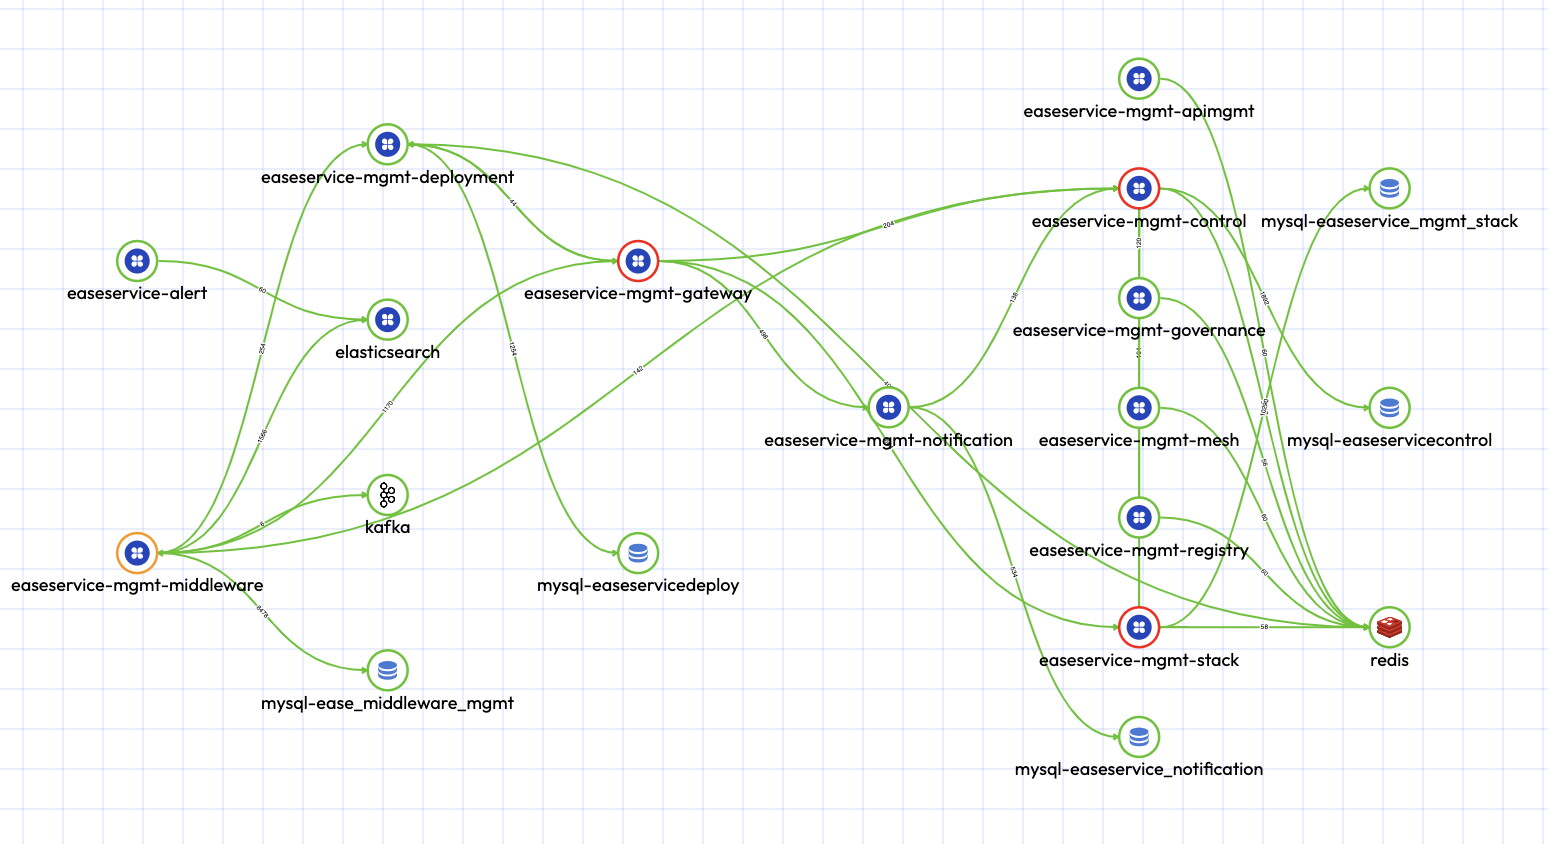
The following diagram show the topology of a typical microservice architecture.
Initially, these APM products competed with each other, with each manufacturer making products with their own proprietary specifications and standards. As a result, they could not interconnect with each other, which led to non-stop wheel building as each vendor had to make a complete APM system, whether open source or closed source. Later, the whole industry slowly began to form some industry standards and specifications to solve the problem of interconnection between these heterogeneous and non-standard systems.
The following products and specifications are frequently mentioned:
| Open-source Products | Commercial products | Specifications |
|---|---|---|
| Zipkin[1] | DataDog[2] | OpenZipkin[3] |
| Jaeger | Dynatrace[2] | OpenTracing[3] |
| SkyWalking | AppDynamics[2] | OpenCensus[3] |
| Pinpoint | New Relic[2] | OpenTelemetry[3] |
| Elastic APM | Google Cloud Trace | |
| … | Azure Application Insights | |
| … | AWS X-Ray | |
| … | … |
[1] Among open-source products, Zipkin is an open-source product made by Twitter based on the Google Dapper Paper and is the most faithful implementation of the paper of any APM. Zipkin is also a very open and sophisticated product, also used by Spring Cloud’s Sleuth.
[2] There are many commercial products, the better-known ones included: Dynatrace, AppDynamic, New Relic, and Datadog.
[3] OpenZipkin, OpenTracing, and OpenCensus are three different standards and OpenTelemetry is in the process of integrating OpenTracing and OpenCensus, but it is not yet complete.
Since there are so many distributed APM products and they don’t collaborate with each other, as a user, which one should I use? The best option is vendor-neutral and in line with industry standards, where standards exist so that you can fully utilize the achievements of the community and enjoy the benefits of open source. However, we have seen that even with open source APM, many implementations are relatively proprietary and closed in terms of data format. Compared to other open-source products, Zipkin is relatively open and the most compliant implementation of the Dapper paper; also, OpenTelemetry will be the ultimate future standard and specification. We believe that there are two aspects of the matter that users need to consider carefully:
The software architecture should be open enough for easy integration with other open-source software components.
To be able to evolve to a more forward-looking standard in terms of standards.
Motivation and Principles
Why did we develop a new Java Agent? The main motivations and reasons are the following.
1. All-in-One Agent
We expect EaseAgent to be a uniform Java Agent, instead of fragmented. Nowadays, there are too many monitoring systems, each doing their own thing, a tracing system, a metric system, a logging system, and also middleware like MySQL monitor and so on. However, having the data alone is useless, only by correlating them together can valuable information be obtained. The data will not correlate if it is in different systems. So we need a way to put all the data together. Currently, there is no uniform Agent that does both Metrics and Tracing, either Tracing only or Metrics only.
2. Easy to extend and customize
We need it to be easily extended and updated, as users will use a variety of frameworks, libraries, middleware, and runtime environments, and there may be new frameworks, libraries, and middleware in the future, and even proprietary middleware developed by users. Therefore, a well-designed Java Agent must be able to respond quickly to change, allowing it to be extended and customized through a simple mechanism.
3. Just a lightweight Java Agent The APM is a bypass system that should have no or minimal impact on the performance of the business application, so we are looking for a lightweight, free, and open Java Agent as a collector, rather than a tied up and complete APM system. It should be able to integrate seamlessly with other open systems to form a complete APM system.
4. Not only a monitoring agent
We believe that observing a system is not the eventual objective; the eventual objective is to improve the SLA of the system. So it is not only about collecting data, it should also facilitate other control systems to manage and enhance the entire distributed microservice architecture to improve the SLA of the service.
Features of EaseAgent 2.0
Standardized, highly open, and easily integrated with other open-source products. It can be directly integrated with Kafka, Prometheus, Zipkin, Tempo/Grafana, and other standard compliant components are supported too.
Easy to extend and customize, enhancement extensions can be achieved in a dozen lines of code through the Plugin mechanism and Java-Macher-DSL.
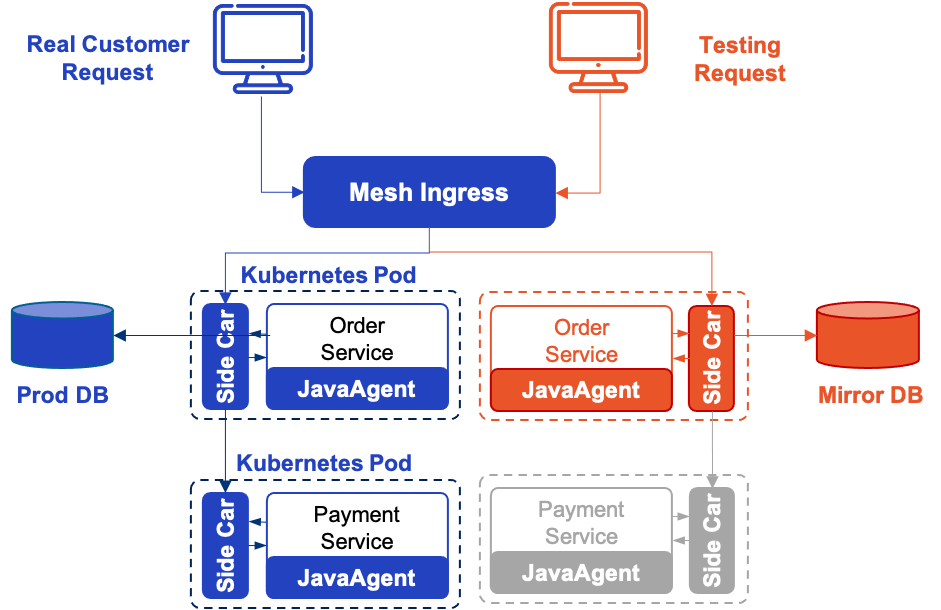
Affinity with Cloud Native. Unlike most Java Agents, which are only used for observed data collection, EaseAgent can collaborate with ServiceMesh to provide control capabilities, enabling service governance, traffic redirection, and stress testing of production environments. The following is the diagram of a full stress test on a production environment, for more details please refer to Full Stack Stress Test on Production.
Comprehensive Data Collection
Tracing
EaseAgent’s Tracing data format is fully compatible with the OpenZipkin standard. The data format and web interface can be adapted via the Encoder/Sender plug-in of the Reporter module to support the export of OpenTelemetry format data to other compatible backend platforms.
Metrics
EaseAgent can collect the following metrics data of various middleware including but not limited to HTTP requests:
- Throughput (m1, m5, m15)
- Error throughput (m1err, m5err, m15err)
- Error throughput percentage (m1err, m5err, m15err)
- Latency (p25, p50, p75, p95, p98, p99)
- Execution duration (min, mean, max)
For more specific metrics, please refer to: Prometheus Metrics
Application Log
We have designed the EaseAgent application log collection module in accordance with the OpenTelemetry log data model. The current export is a proprietary JSON log format, but due to its standardization, it can be easily exported in other formats via the Encoder plugin, so feel free to explore and participate in the Encoder plugin development.
EaseAgent’s Open Compatibility
EaseAgent benefits from standardization and it can be integrated very quickly and seamlessly with open-source solutions such as Prometheus/Zipkin/Tempo/Grafana to form a complete APM system. We have implemented non-intrusive monitoring via EaseAgent in MegaEase’s official demo project, EaseAgent Spring PetClinic, which makes no changes to the official Spring demo project Spring-PetClinic, , and exported the data to Prometheus and Grafana/Tempo to form a completed APM system. The following is a presentation of the data.
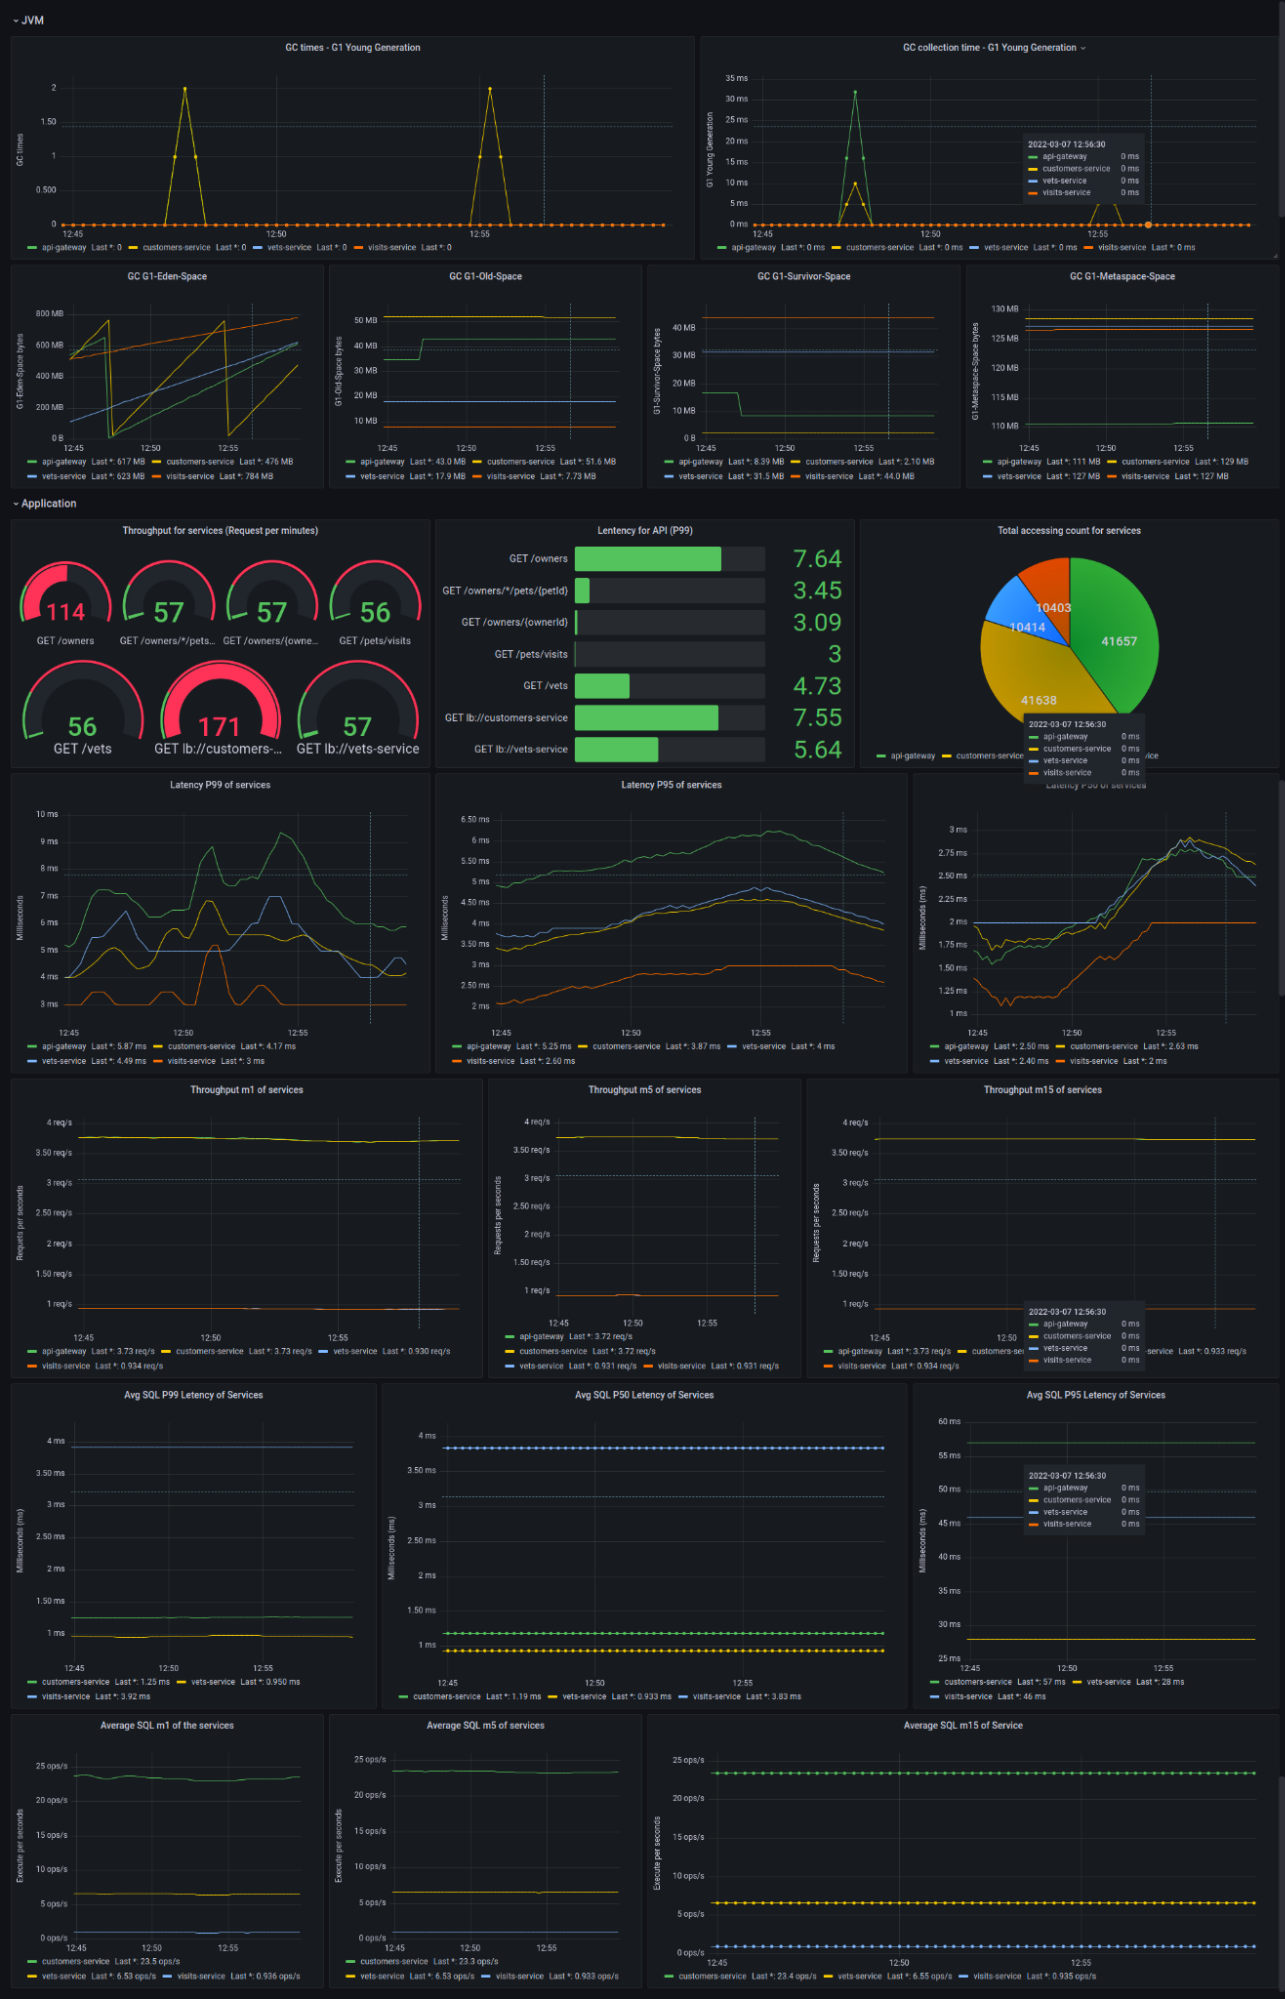
Grafana Metrics Dashboard
EaseAgent metrics include application layer and middleware metrics, which includes throughput rate, abnormal throughput rate, latency, etc.
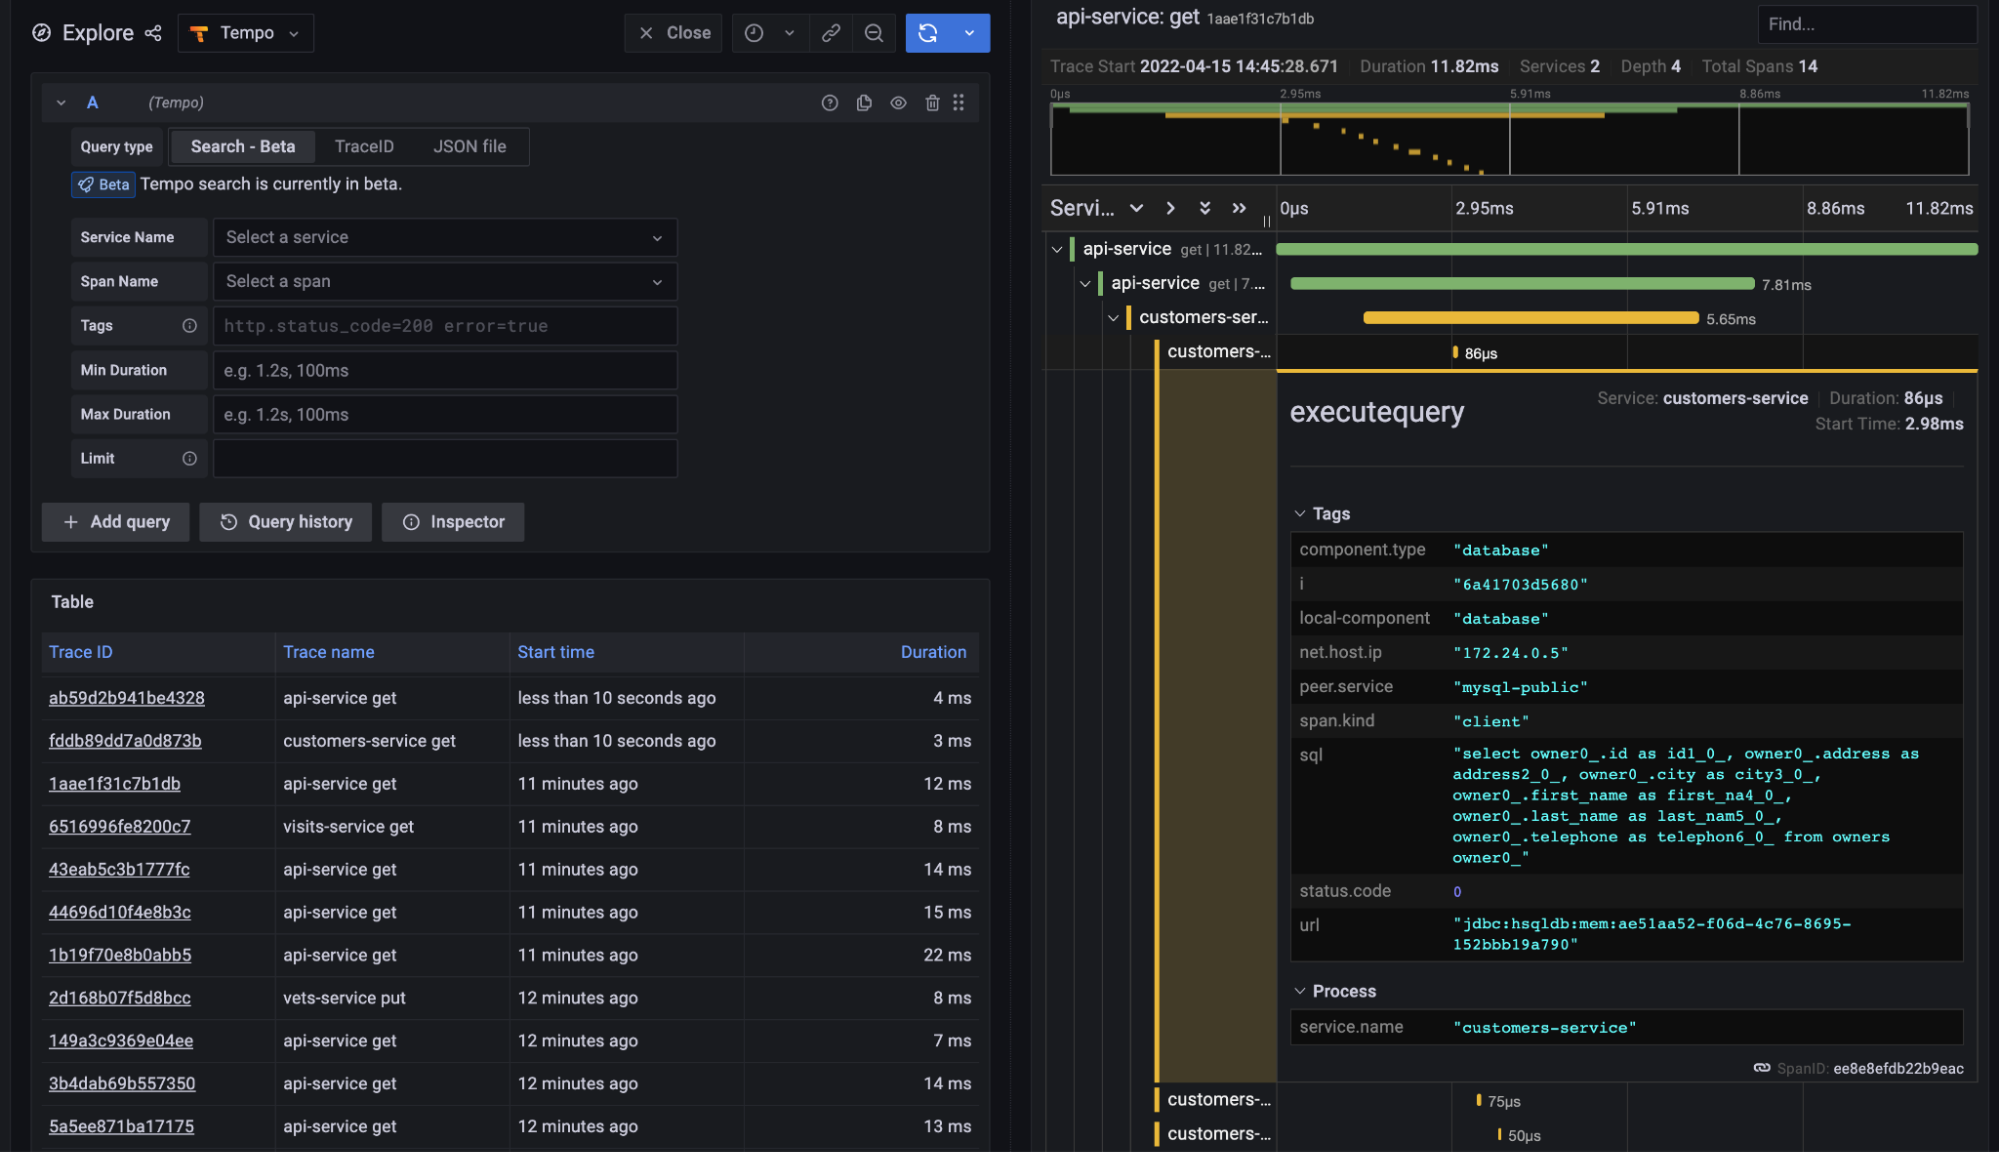
Grafana Tracing Dashboard
Tracing data, which can be searched and viewed from Grafana’s Explore.
In the next section, we will describe the architecture and enhancement plugin design of EaseAgent 2.0 and how to develop the enhancement plugin.
Architecture and Plugin Design
Architecture
The architecture of EaseAgent 2.0 is shown in the diagram below. In version 2.0, we have introduced a enhancement plugin mechanism to meet the needs of different businesses in terms of extensions to the EaseAgent.
The essential feature of all Java Agents is the enhancement of specific methods to implement enhanced services, such as Tracing and Metric services. Similarly, EaseAgent’s enhancement plugin mechanism has been designed to be an easy to understand and use, efficient and reliable plugin framework that allows users to easily enhance specific methods to achieve business requirements.
For ease of understanding and use, we have abstracted the plugin into three elements: Points, Interceptors, and AgentPlugin.
- Points, for determining where to enhance;
- Interceptors used to define what to do, that is, the code to be executed at the enhancement points identified by Points;
- AgentPlugin, make the plugin configurable and dynamically update at runtime.
In terms of architecture, we need to address the following issues:
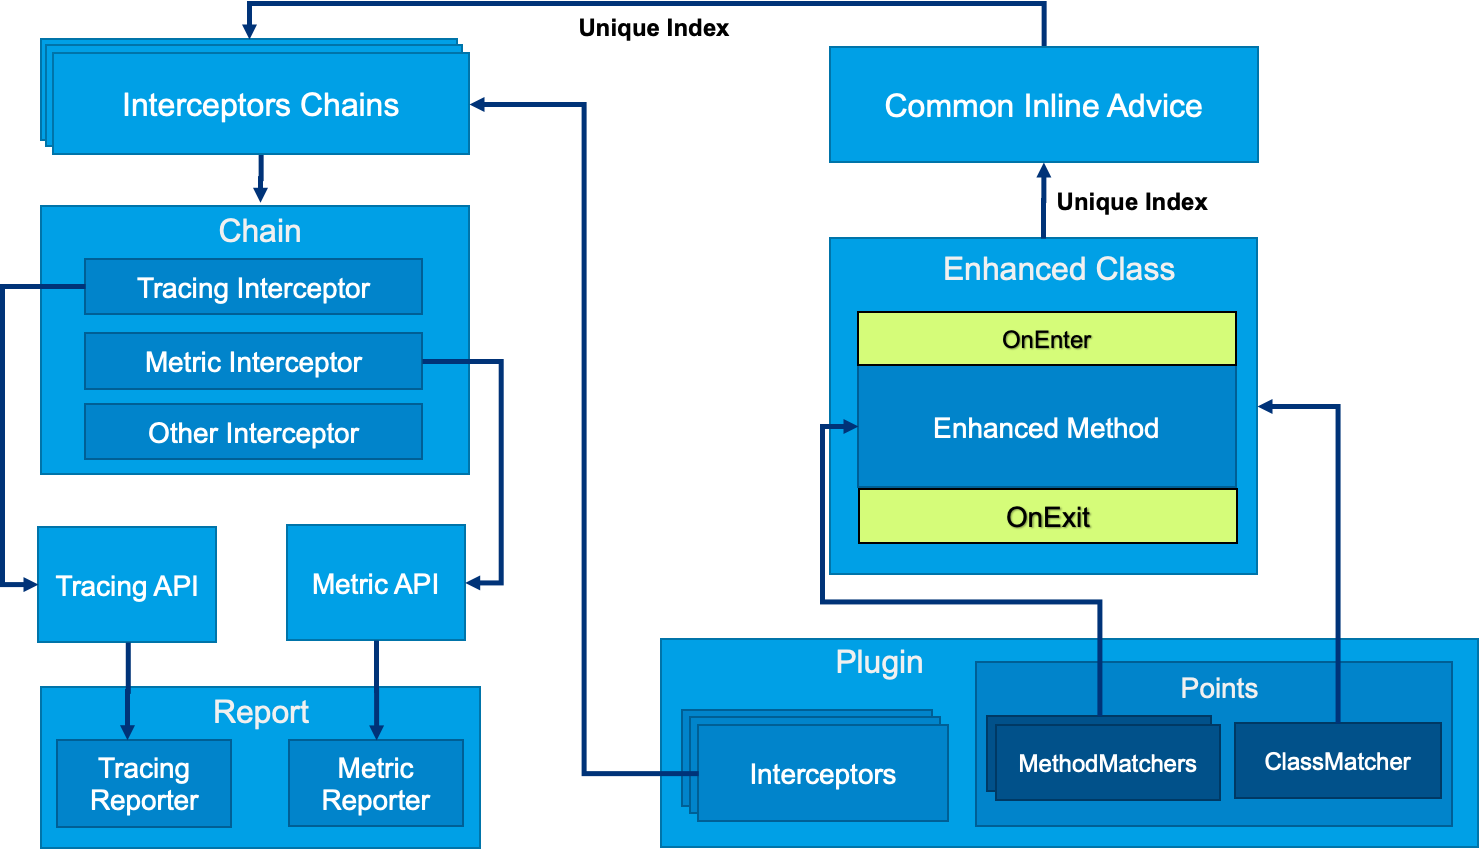
Allowing multiple plugins to perform multiple enhancements to the same method. We assign a unique Index to the method point, which is used as an array index to retrieve the corresponding Interceptors Chains. The Interceptors Chain is made up of the Interceptor of each plugin. Then, the enhancement method point is enhanced with a short piece of bytecode that retrieves the Interceptor Chain by unique Index and executes the Interceptor in it;
The plugins can be both independent and interoperable. In an Interceptors Chain, the priorities between Interceptors can be orchestrated and an interface for the exchange of data between Interceptors needs to be provided.
In addition, interceptors are implemented to achieve specific services, so we provide wrapped API interfaces for the most common Tracing and Metric services, allowing the enhancement plugin can accomplish the Tracing and Metric collection more easily with the aid of the API. The Report component is responsible for encoding the data and uploading it to the back-end server, which can also be customized and extended to meet the needs of different data formats and network architectures.
Currently, we have built-in support for the following plugins:
- Data Collection
- Collecting Metric & Tracing Logs.
- JDBC 4.0
- HTTP Servlet、HTTP Filter
- Spring Boot >=2.2.x: WebClient 、 RestTemplate、FeignClient
- RabbitMQ Client >=5.x、 Kafka Client >=2.4.x
- Jedis >=3.5.x、 Lettuce >=5.3.x (sync、async)
- ElasticSearch Client >= 7.x (sync、async)
- MongoDB Client >=4.0.x (sync、async)
- Collecting Access Logs.
- HTTP Servlet、HTTP Filter
- Spring Cloud Gateway
- Instrumenting the traceId and spanId into user application logging automatically
- Supplying the health check endpoint
- Supplying the readiness check endpoint for SpringBoot >=2.2.x
- Collecting Metric & Tracing Logs.
- Data Reports
- Console Reporter
- Prometheus Exports
- Http Reporter
- Kafka Reporter
- Custom Reporter
Enhancement Plugin Design
Now, let’s look at the key points of enhancement plugin design.
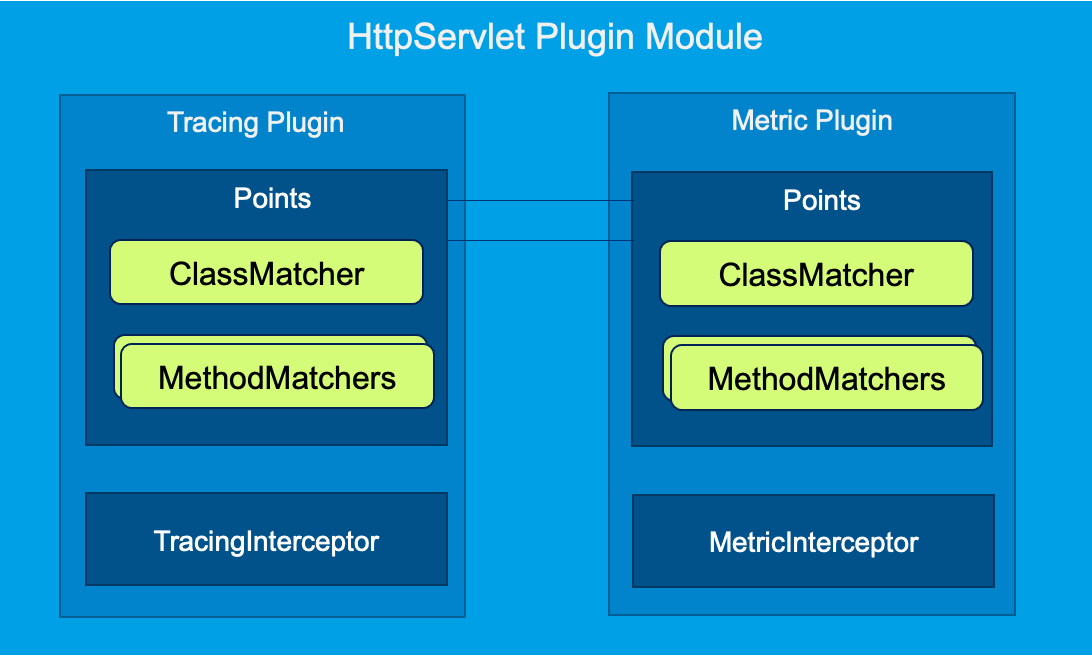
We have abstracted the enhancement plugin into three elements, corresponding to three interfaces. Plugin development is the implementation of these three interfaces, complete with enhancement point definition, enhancement code logic, and configuration information definition respectively. A plugin project module that can contain multiple plugins, as shown in the figure below, the HttpServlet plugin project contains multiple plugin implementations.
Enhancement Points
The definition of enhancement points is achieved through the implementation of the Points interface class, which contains three methods:
public interface Points {
    /**
     * return the defined class matcher matching a class or a group of classes
     */
    IClassMatcher getClassMatcher();

    /**
     * return the defined method matcher
     */
    Set<IMethodMatcher> getMethodMatcher();

    /**
     * When returning true, add a dynamic field to matched classes
     * The dynamically added member can be accessed by AgentDynamicFieldAccessor
     */
    default boolean isAddDynamicField() {
        return false;
    }
}
Points’ three methods are used to define a class matcher, a set of method matchers and whether to extend members to a class. The extended members can be used for data transfer and exchange. For emphasis, EaseAgent will use the method matches to identify the methods to be enhanced in the classes that are matched by the class matcher.
Details on the design of Class matches and Method matcher can be found in our documentation. Matcher DSL or watch video from the 44:10 section.
Interceptor
The interceptor implements specific business logic and is the most important interface of the three elements of the enhancement plugin, which can vary greatly from business to business and is the core interface for plugin development.
What capabilities does the Interceptor interface need to provide for plugin developers to facilitate the development of plugin extensions in various scenarios? The plugin business may be either a data collection business on the data plane, such as Tracing or a behavioral control business on the control plane, such as the Redirection plugin, so the Interceptor needs to give the business logic the ability to access the current method invocation instance, parameters and return values, as well as providing the ability to modify the parameters and return values. These capabilities are provided to the plugin developer via the MethodInfo parameter and its interface, as defined in the Interceptor interface below.
public interface Interceptor extends Ordered {
    void before(MethodInfo methodInfo, Context context);

    void after(MethodInfo methodInfo, Context context);

    default String getType() {
        return Order.TRACING.getName();
    }
    ......
}
Interceptors can be independent and not aware of each other, but collaboration is required in some cases. Multiple Interceptors associated to an enhancement method form an Interceptors Chain, prioritized among themselves, as determined by the Ordered interface. The data transfer and exchange required for collaboration can be implemented flexibly and in various ways depending on the business scenario, but the Context interface provides the basic transfer and exchange capability through the put/get method.
For more design details, kindly refer to Plugin Develop Guide.
Agent Plugin
The AgentPlugin interface is the simplest of the three elements, with only two methods.
public interface AgentPlugin extends Ordered {

     String getNamespace();
     String getDomain();
}
These two method implementations define the configuration prefix of the plugin configuration items for all Interceptors bound to the Plugin:
plugin.[domain].[namespace].[type].key=value
As shown above, where the domain and namespace are defined by the AgentPlugin implementation; The type is defined by the Interceptor’s getType() method. In the Interceptor implementation code, the configuration obtained by Context::getConfig() at any time is the up-to-date key-value map, meaning that the configuration obtained by the getConfig() method will automatically be updated to the latest configuration when it is updated externally.
These, in brief, illustrate how the three elements of the plugin were designed and implemented. The following are two examples.
A simple enhancement plugin example Simple Plugins / Simple Plugin - shared video
A real enhancement plugin for Tracing HttpServlet Tracing Plugin / watch shared video
For more information on how to debug the Agent, have a look at the EaseAgent Debug FAQ and the shared Video in our community.